Following bar-diagram gives the water level (in metres) of three rivers in five months.
1 Q) Which river and in which month was showing highest water level?
1) A-March 2) B-Jan 3) C-March 4) A-May 5) B-Feb
2 Q) "What is the average water level of River A in all the five months?
1) 80 m 2) 85 m 3) 83 m 4) 81 m 5) None of these"
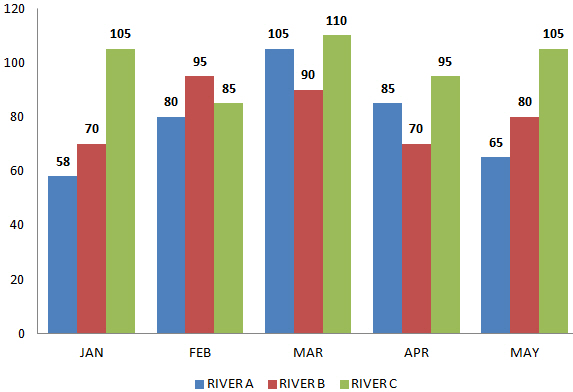
3 Q) "What is the respective ratio between River C in April and River A in February?
1) 19 : 16 2) 12 : 17 3) 19 : 13 4) 11 : 13 5) None of these"
4 Q) "If the danger level of all the three rivers is above 90 metres, which river has crosseddanger level in April but not in February?
1) A 2) C 3) B 4) Both A & C 5) None of these"
5 Q) "Water level of River A in March is what percent of the water level of River B in May?
1) 76.2% 2) 75% 3) 131.25% 4) 125% 5) None of these"
Also Read:
- Exercise 13: PIE-CHARTS
- Exercise 12: Line Graphs
- Exercise 11: Pie Charts
- Exercise 10: Line Graphs Data
- Exercise 9: Grouped Bar Graphs
- Exercise 8: Line Graphs Data Interpretation
- Exercise 7: Line Graphs Data Interpretation
- Exercise 6: Line Graphs Data Interpretation
- Exercise 5: Line Graphs- Data Interpretation
- Exercise 4: Bar Graphs Data Interpretation
- Exercise 3 : Pie chart and Tables Combined
- Exercise 2: Tabulation
- Exercise 1: Data Interpretation
Advertisements
No comments:
Post a Comment